GraphQL monitoring for Node.js
Unlock deep insights into your Node.js app's GraphQL performance with AppSignal. From slow queries to error rates, AppSignal helps you identify and fix common GraphQL issues efficiently.
Key GraphQL monitoring features
Error Tracking
Quickly pinpoint and resolve GraphQL errors in your Node.js app. Learn more
Performance Monitoring
Identify and optimize slow GraphQL queries to improve your app's responsiveness. Learn more
Anomaly Detection
Receive real-time alerts for any anomalies in your GraphQL queries. Learn more
Metric Dashboards
Leverage metric dashboards to visualize and track GraphQL performance metrics. Learn more
GraphQL performance insights
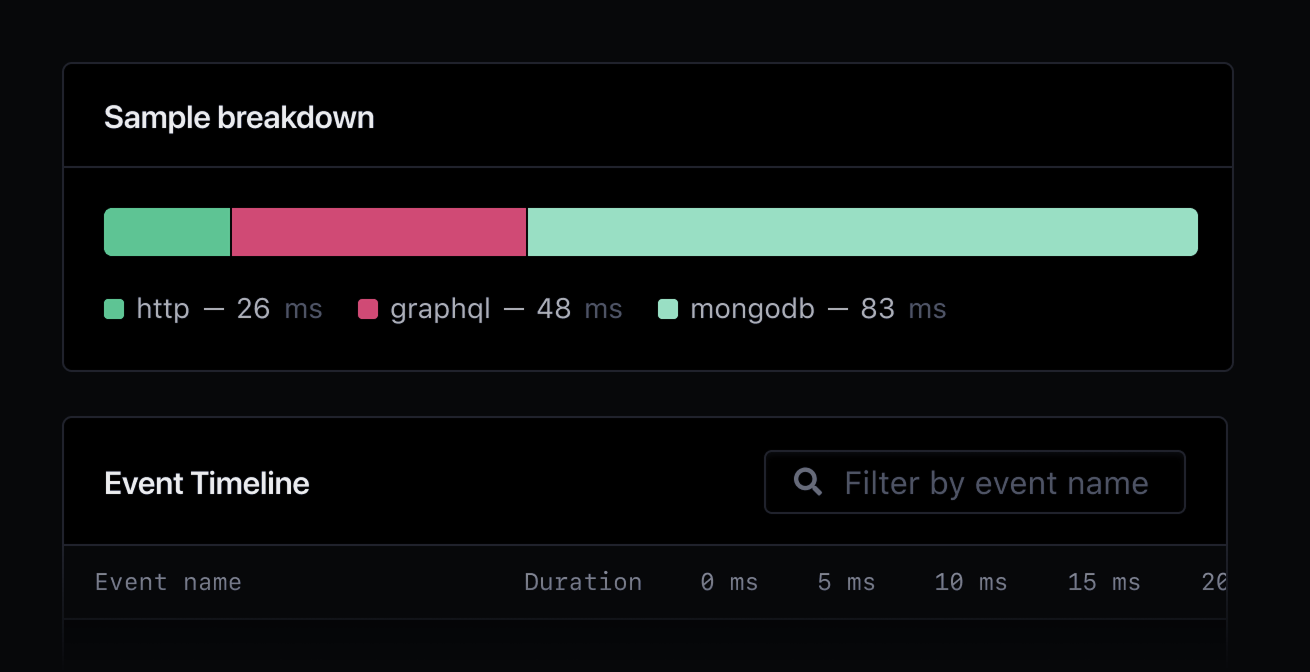
Simple sample breakdowns
Dive deep into GraphQL query performance with AppSignal's detailed sample breakdowns and event timelines. Quickly identify and optimize slow queries.
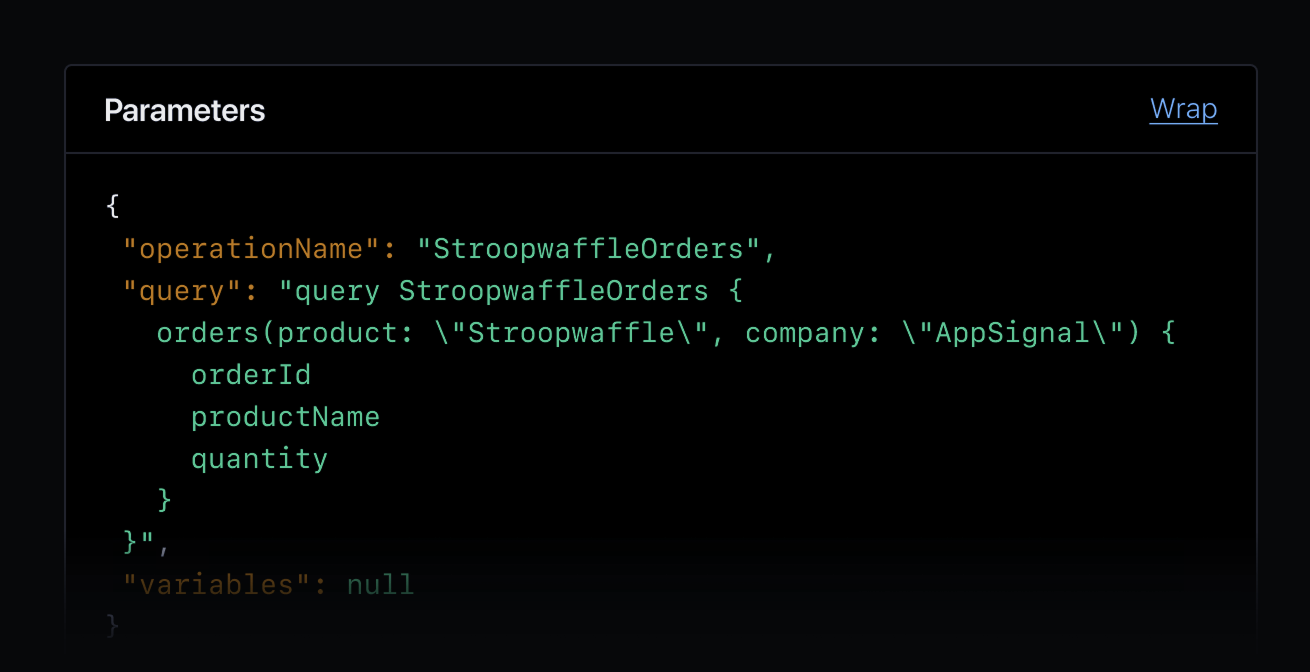
Real-time query insights
Drill down to query parameters for contextual insights into the performance of your GraphQL application.
Why Monitor GraphQL?
Leveraging AppSignal's Node.js APM for GraphQL monitoring provides invaluable insights into query performance, helping you identify and resolve issues quickly.
With a suite of monitoring features tailored for GraphQL, including Error Tracking, Performance Monitoring, and Anomaly Detection, AppSignal has all the tools needed to enhance the performance and reliability of your GraphQL applications.
AppSignal GraphQL monitoring helps you
Enhance GraphQL query performance in your Node.js applications.
Detect and resolve slow GraphQL queries swiftly.
Scale your GraphQL service confidently with performance insights.
Prevent memory leaks and optimize query efficiency.
Gain granular insights into GraphQL query performance within your Node.js environment.
Understand the impact of GraphQL queries on your application's overall performance.
Prevent performance degradation caused by complex queries.
Start monitoring GraphQL today
Ready for deep insights into GraphQL performance? Get started by signing up, installing AppSignal, and exploring our Node.js documentation for more detailed setup instructions.


