Garbage Collection monitoring
AppSignal gives you deep insights into Garbage Collection performance, ensuring it's effectively managing your application's memory and preventing your application from suffering memory outages.

Key Garbage Collection monitoring features
Performance Monitoring
See how long Garbage Collections take to run. Learn more
Automated Dashboards
Visualize and track your Garbage Collection performance and frequency. Learn more
Monitor and debug Garbage Collection performance in Ruby
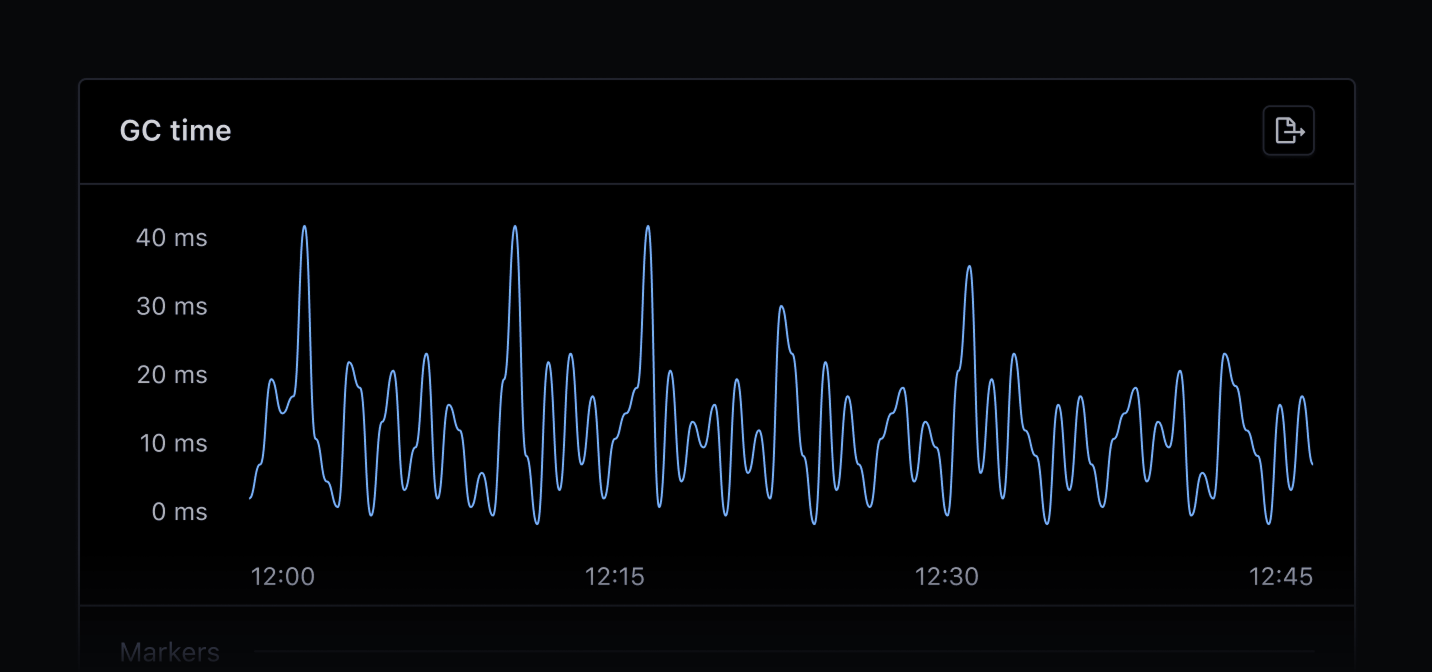
Track the speed of Garbage Collection.
With our RubyVM automated dashboard, you can track how long each Garbage Collection process takes to run.
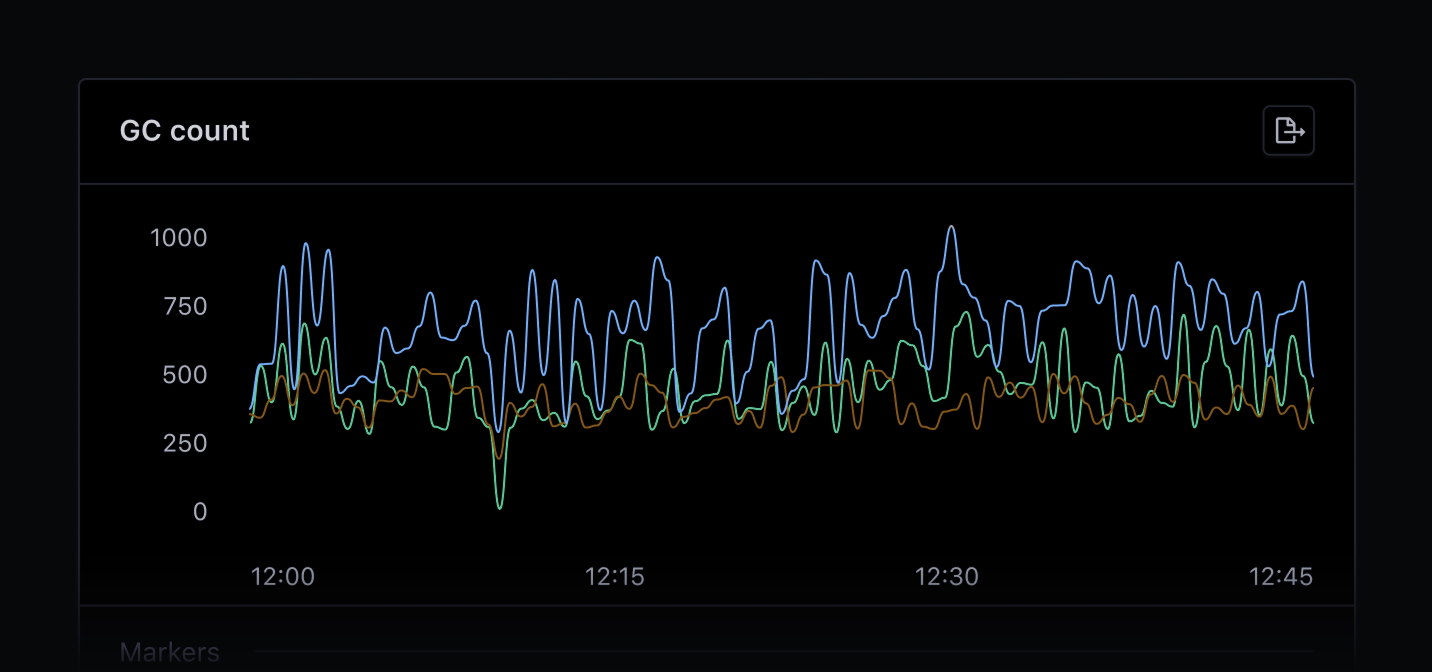
See how frequently Garbage Collection runs.
Track the frequency of major and minor Garbage Collection runs on the Ruby VM automated dashboard.
Why monitor your Garbage Collection in Ruby?
AppSignal's Ruby APM gives you deep insights into your application's performance metrics. By monitoring your Garbage Collection process, AppSignal can give you deeper contextual insights into the performance and health of your application's memory.
Developers love using AppSignal features like exception monitoring, anomaly detection, and logging to gain a helicopter view of their application's performance.
AppSignal Garbage Collection monitoring helps you
Understand how long Garbage Collection takes.
See how frequently Garbage Collection runs.
Gauge how healthy your application's memory allocation is.
Start monitoring Ruby VM Garbage Collection today
Ready for deep insights into your Garbage Collection performance? Get started by signing up, installing AppSignal, and exploring our Ruby documentation for more detailed setup instructions.


