Prisma monitoring for Node.js
AppSignal offers deep Prisma ORM performance insights. Monitor function performance, catch errors early, and easily optimize your database queries.

Key Prisma monitoring features
Error Tracking
Identify and resolve Prisma errors quickly. Learn more
Performance Monitoring
Analyze and fine-tune the performance of your Prisma queries. Learn more
Anomaly Detection
Receive alerts for any unusual Prisma activity. Learn more
Metric Dashboards
Track and visualize your Prisma metrics in real-time. Learn more
Prisma performance insights
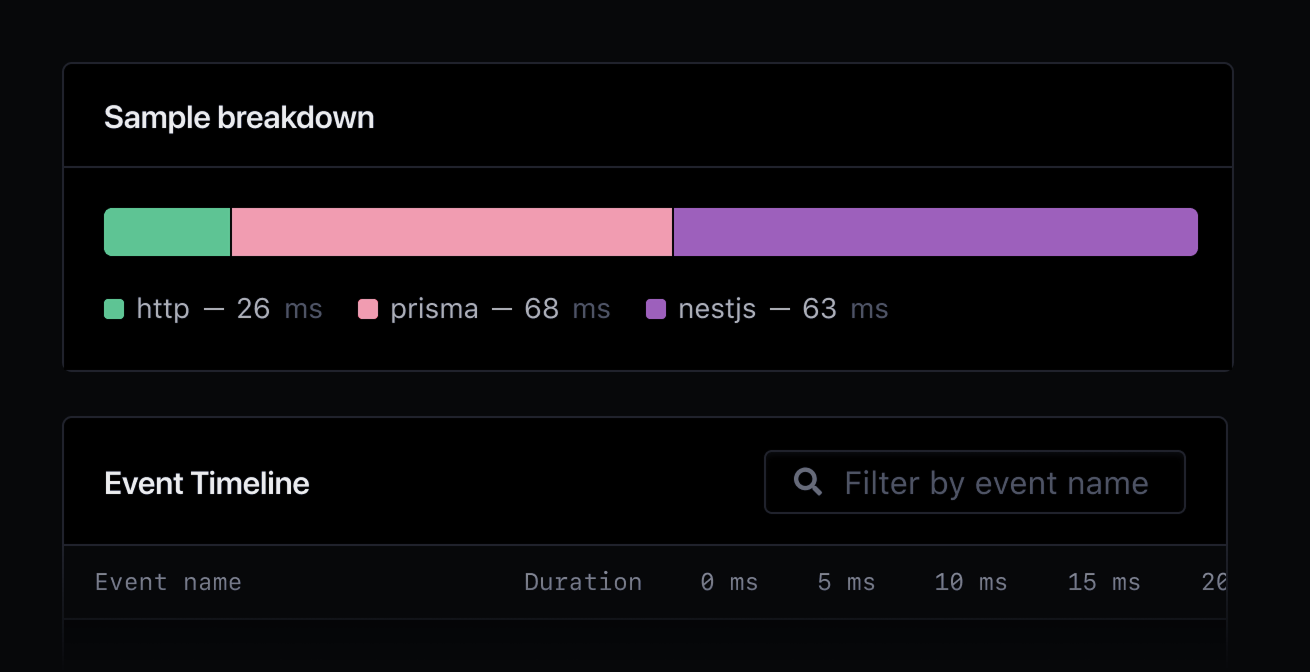
Query analysis
Analyze Prisma query performance to identify and optimize slow queries with AppSignal's Sample Breakdown.
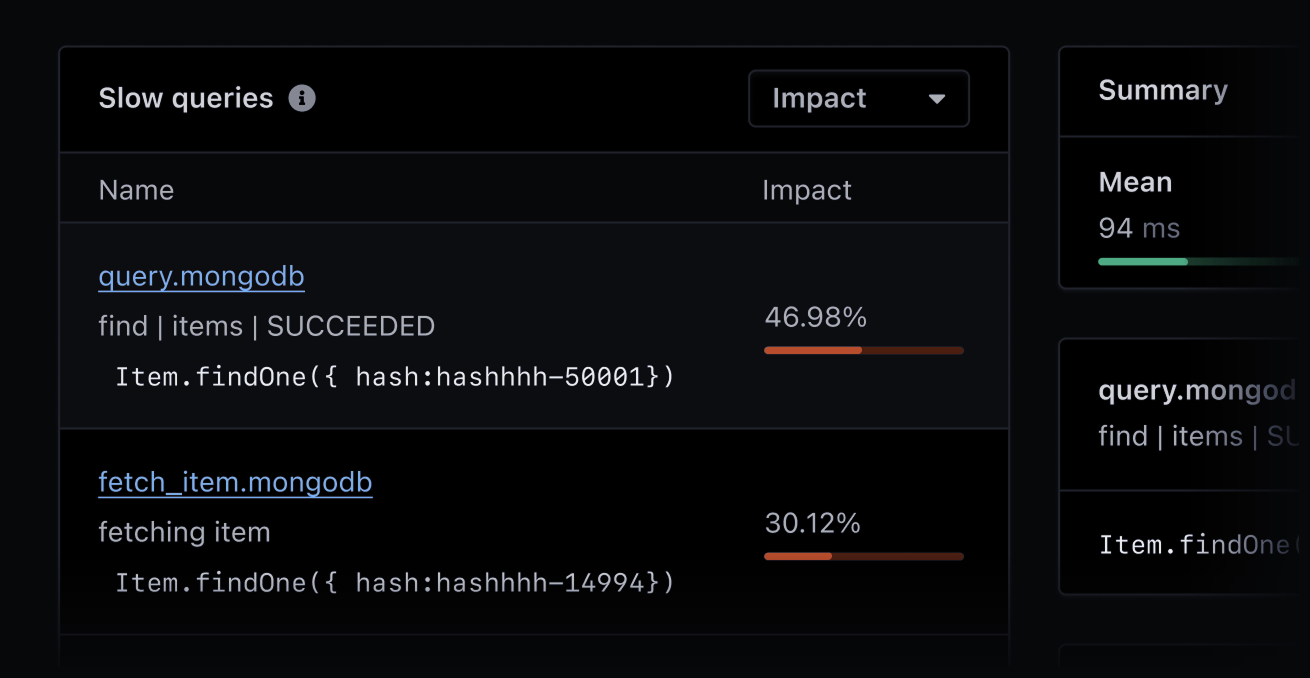
Squash slow queries
Gain a clear overview of slow queries in your app with AppSignal's Slow Queries feature, offering insights into performance impact and more.
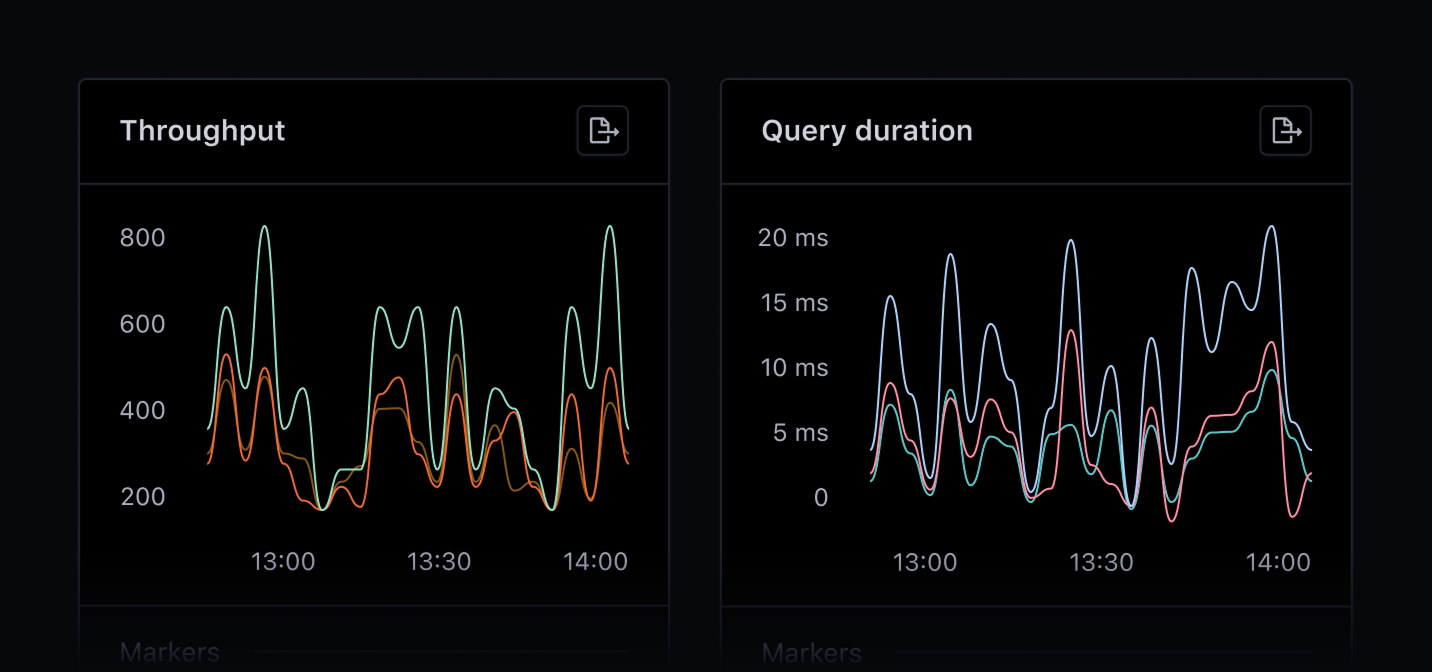
Track database performance
Monitor database performance with AppSignal's real-time MongoDB, PostgreSQL and SQL dashboards. Click anywhere on a graph to delve deeper into your app's state.
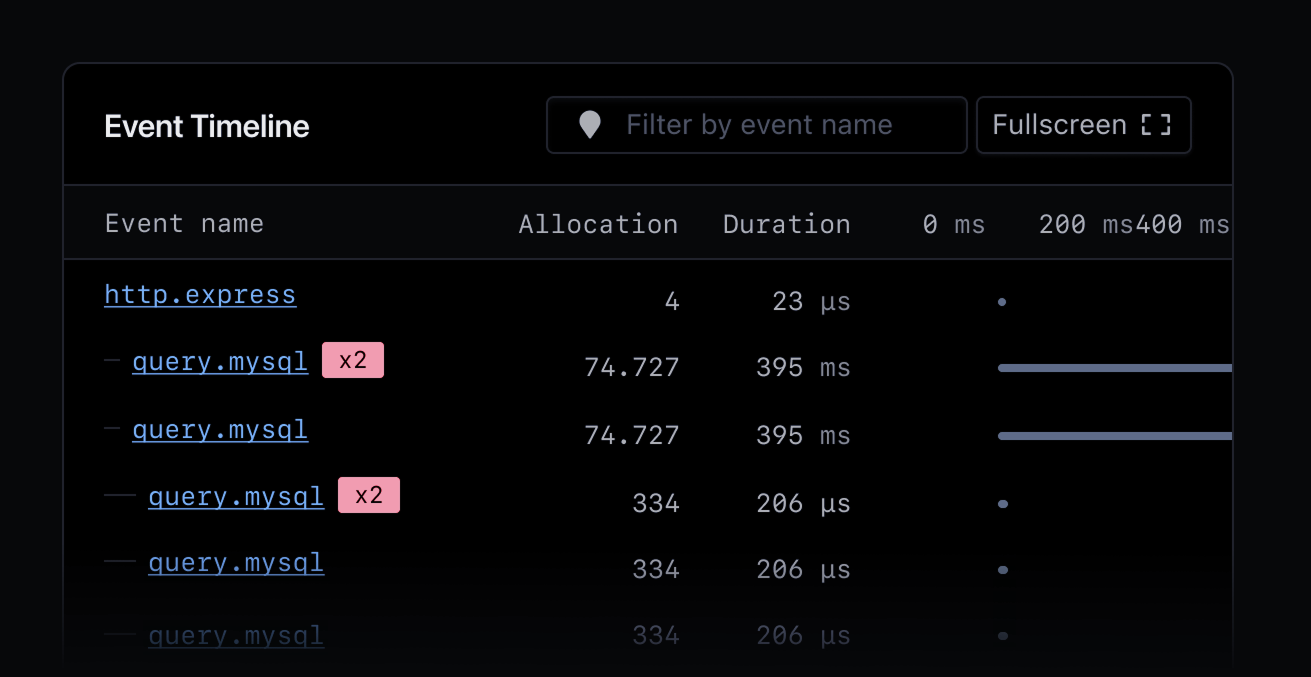
Identify N+1 queries
Monitor N+1 queries to optimize MongoDB, PostgreSQL and SQL performance. Keep your app responsive and scalable by locating and removing redundant requests.
Why monitor Prisma?
Reliable Node.js applications need robust and scalable ORMs. AppSignal's Node.js APM helps you fine-tune your Prisma integration. With deep insights into query performance, errors, and response times, AppSignal helps developers proactively tackle Prisma-related problems.
AppSignal's user-friendly suite of monitoring tools, like Error Tracking, Anomaly Detection, and Logging, provide you with the helicopter view you need to manage and improve your Node.js app's overall performance.
AppSignal Prisma monitoring helps you
Deep-dive into Prisma query performance.
Find and fix slow queries.
Prevent N+1 queries creating bottlenecks.
Optimize database interactions to improve the responsiveness of your application.
Monitor the health of your application's database with comprehensive dashboards.
Gain insights into Prisma operations within the context of your Node.js application.
Configure alerts for anomalies and keep ahead of performance issues.
Start monitoring your Prisma ORM today
Ready for deep Prisma performance insights? Get started by signing up, installing AppSignal, and exploring our Node.js documentation for more detailed setup instructions.


