Sinatra monitoring
Track the performance of your Sinatra app with AppSignal, squash bugs, and solve common problems like performance bottlenecks and controller errors.

Key Sinatra monitoring features
Error Tracking
Find and fix errors in your Sinatra app. Learn more
Performance Monitoring
Optimize the performance of your Sinatra app's controllers, views, database queries, and more. Learn more
Anomaly Detection
Be notified when your Sinatra app experiences anomalies, like high error rates, or memory usage. Learn more
Metric Dashboards
Visually track your Sinatra app's health and performance. Learn more
Sinatra monitoring made simple
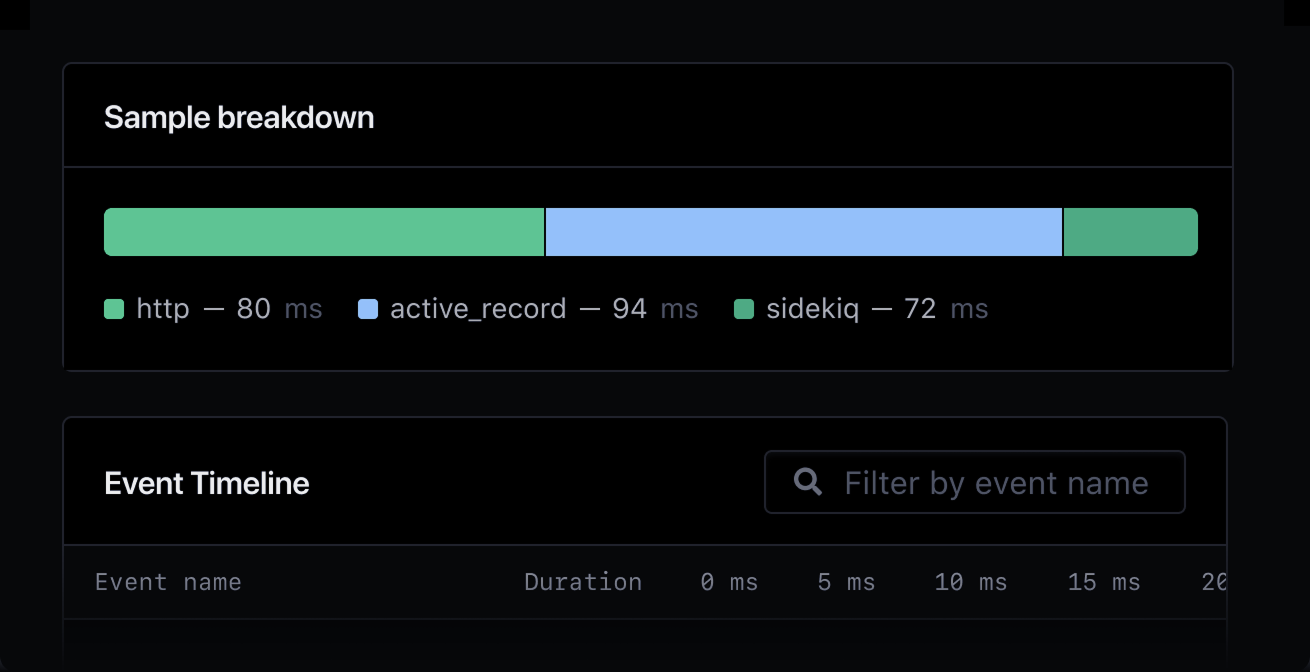
Beautiful performance breakdowns
AppSignal's performance samples and event timeline help you quickly analyze how your application is performing, allowing you to identify problems and areas for optimization.
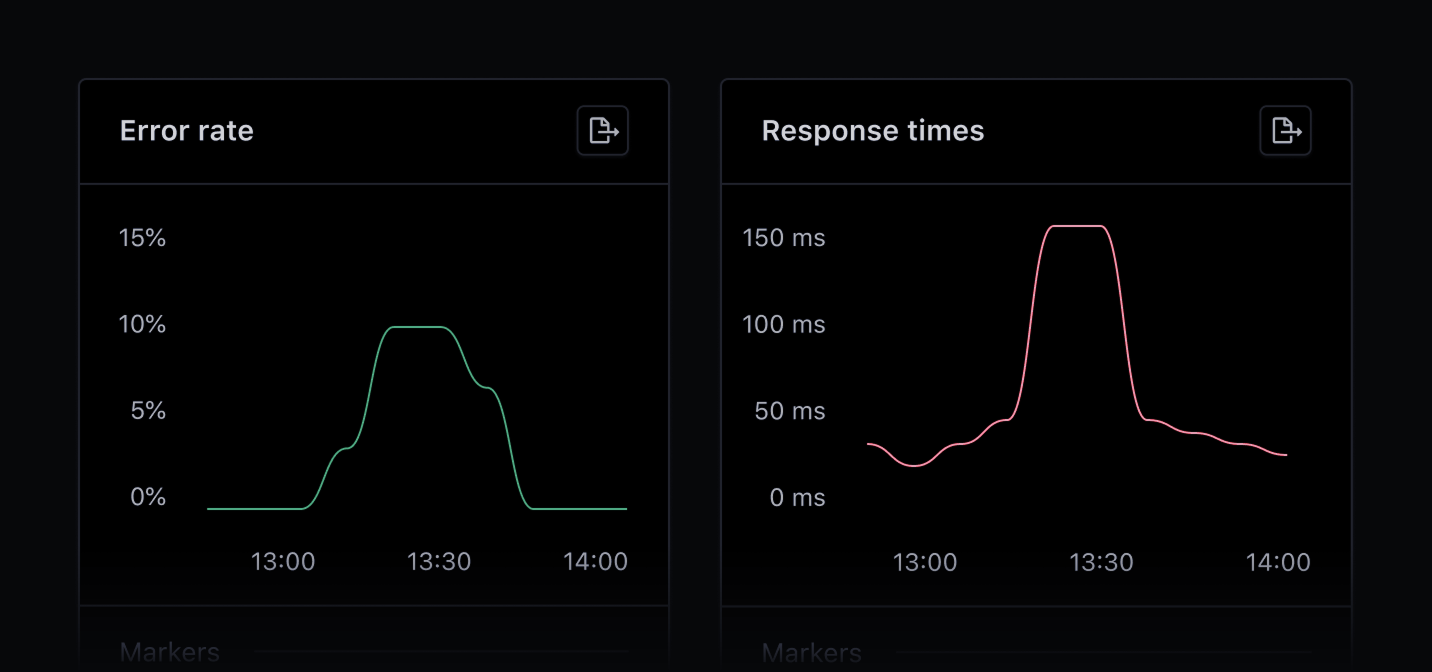
Real-time Sinatra monitoring
Create metric dashboards to help track key Sinatra performance metrics, such as error rates, throughput, and response times.
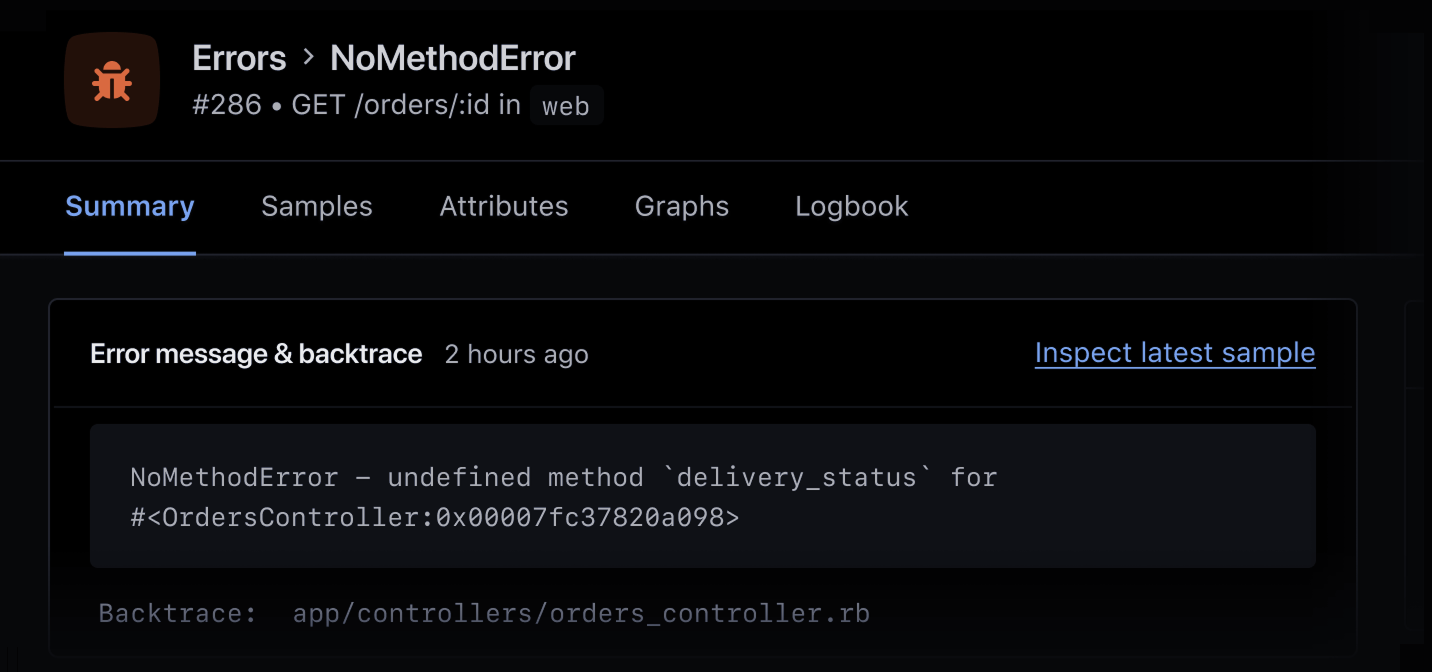
Extraordinary Error Tracking
Squash bugs and quickly get to the root cause of an issue with AppSignal's Ruby error reporting. View error messages, backtraces, and an overview of an exception's cross-deploy occurrence history.
Why monitor Sinatra?
AppSignal's Ruby APM offers performance insights tailored for Sinatra applications, empowering you to refine and optimize your Sinatra app's performance. Find and fine-tune slow queries, fix errors, and prevent performance bottlenecks with AppSignal's monitoring toolkit.
AppSignal's developer-friendly monitoring toolkit includes exception tracking, anomaly detection, logging, and much more, giving you the helicopter view needed to confidently scale your Sinatra application.
AppSignal Sinatra monitoring helps you
Optimize the performance of Sinatra controllers, views, models, and more.
Proactively find and fine-tune sluggish database queries.
Gain an in-depth understanding of your Sinatra app's performance with AppSignal's event-level performance insights.
Understand your Sinatra app's performance in the broader context of your application's stack.
Get to the root cause of an issue quickly with Error tracking.
Dive deep into your application's performance with AppSignal logging.
Start monitoring your Sinatra app today
Ready for deep Sinatra performance insights? Get started by signing up, installing AppSignal, and exploring our Ruby documentation for more detailed setup instructions.


