Capistrano monitoring
AppSignal gives you deep insights into the performance of your Ruby applications. With AppSignal and Capistrano, you can keep track of your application deployments and pinpoint problems with a specific code change.

Key Capistrano monitoring features
Error Tracking
Pinpoint an error to a specific deployment. Learn more
Performance Monitoring
Understand how your application's performance has changed based on previous deployment data. Learn more
Track issues across deployments
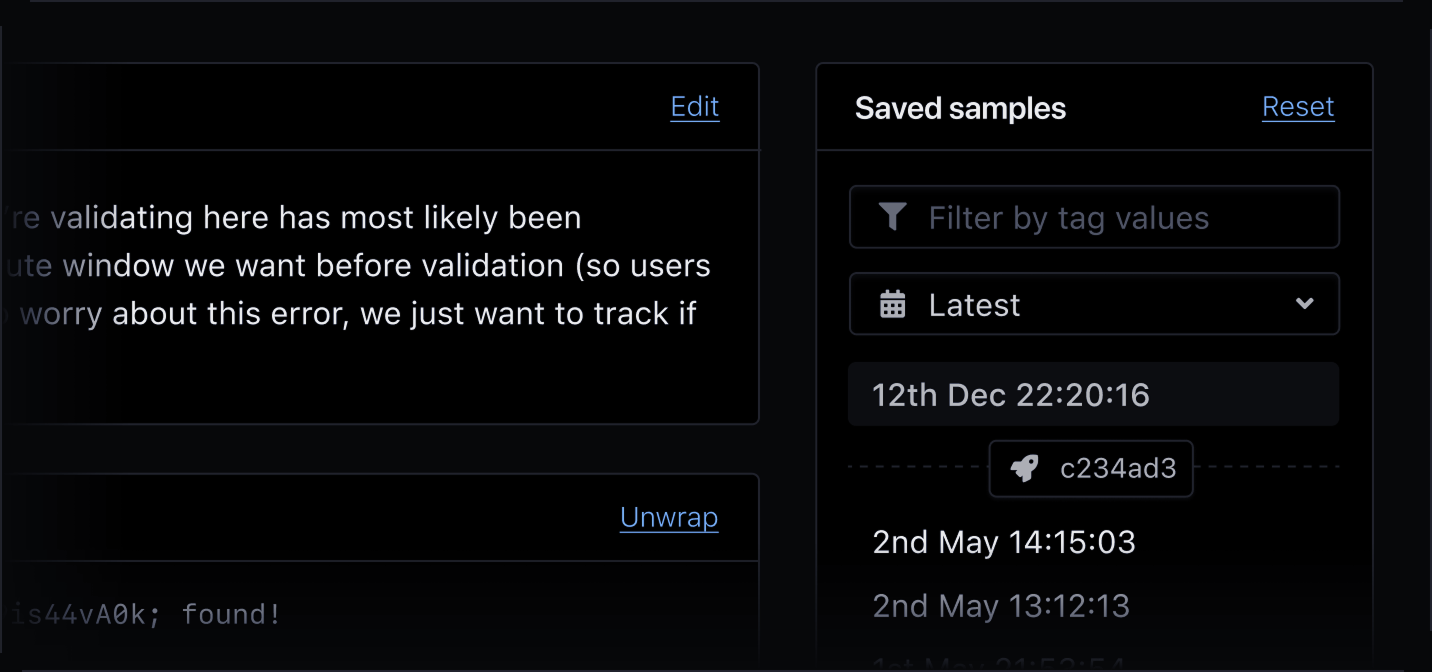
See where and when an issue occurs
AppSignal automatically tags in which deployment an issue occurs, allowing you to pinpoint in which deployment an issue was first reported, and how frequently it occurs in subsequent deploys.
Why monitor your Capistrano deployments?
AppSignal's Ruby APM gives you deep insights into your application's performance metrics. By monitoring your Capistrano deployments, AppSignal can give you deeper, deploy-based contextual insights into your application's performance.
Our developer-driven suite of monitoring features like exception monitoring, anomaly detection, and logging, AppSignal help you connect the dots between your application's performance and the rest of your application's stack.
AppSignal Capistrano monitoring helps you
Track performance incidents across deployments.
Pinpoint which deployment was the root cause of a problem.
Track what impact code enhancements have on your application's performance.
Start monitoring your Capistrano deployments today
Ready for deep insights into your application's performance per deploy? Get started by signing up, installing AppSignal, and exploring our Ruby documentation for more detailed setup instructions.