Shoryuken SQS monitoring
Monitor the performance of your Ruby app's Shoryuken SQS messages with AppSignal and solve common issues like slow or failing Shoryuken jobs.

Key Shoryuken monitoring features
Error Tracking
In-depth error reporting for your Shoryuken jobs. Learn more
Performance Monitoring
Enhance Shoryuken job performance with AppSignal's performance insights. Learn more
Simple Shoryuken job monitoring
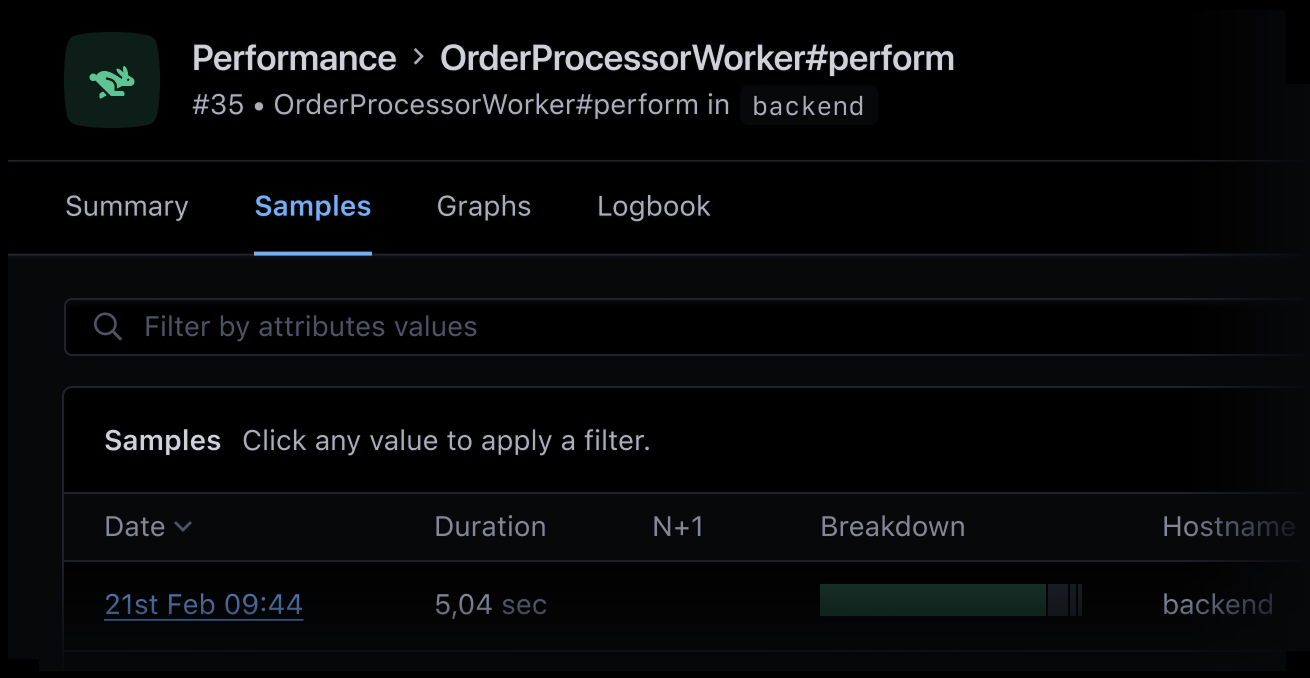
Event-level insights
AppSignal's performance monitoring gives you a detailed overview of how your Shoryuken jobs perform, making it easy to find and fix slow or underperformant jobs.
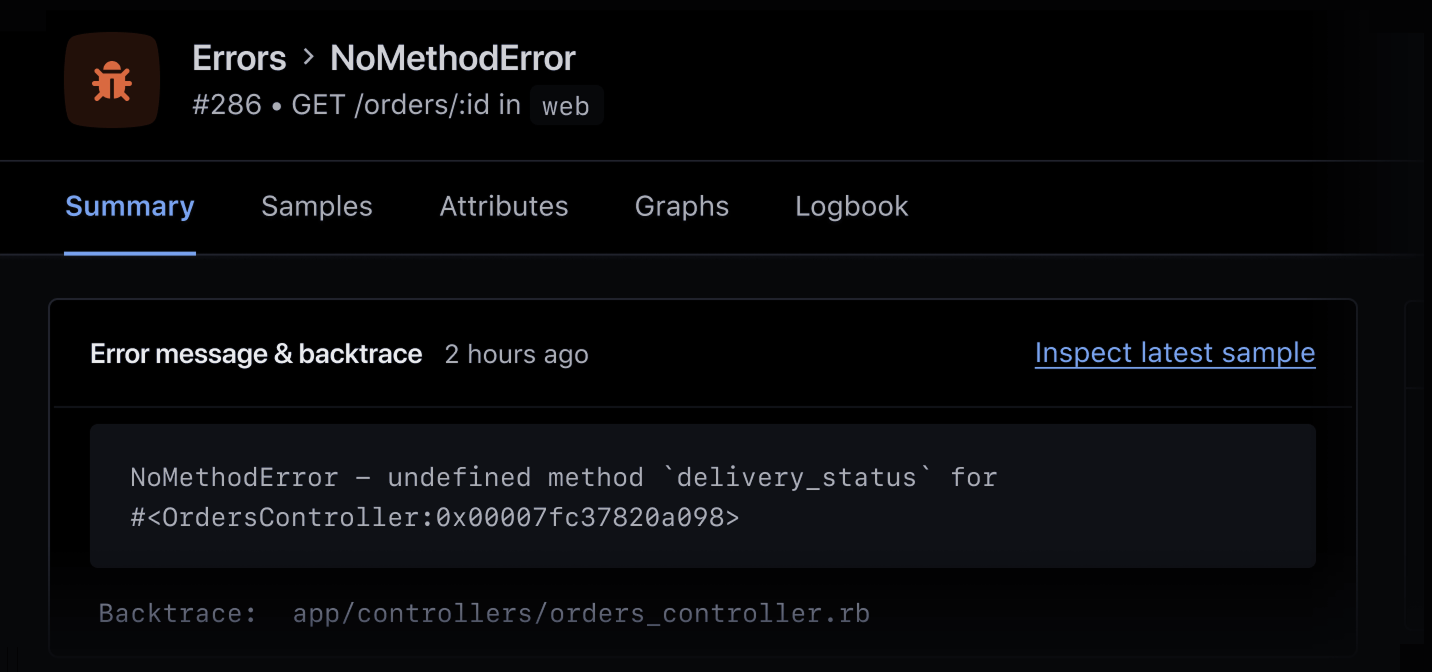
Exceptional error tracking
Tackle bugs and quickly identify the root cause of a problem using AppSignal's Error reporting. Inspect error messages and backtraces with an extensive overview of exceptions' occurrence history.
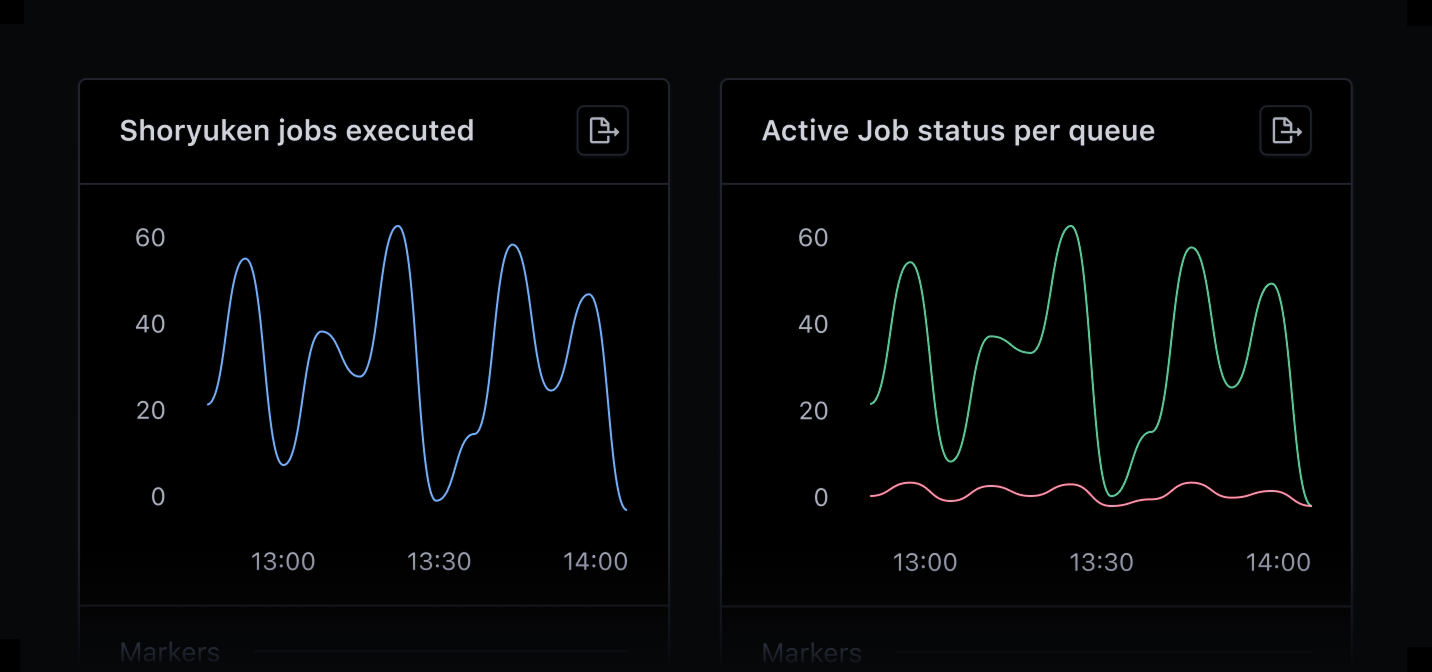
Magic Metric Dashboards
Monitor Shoryuken jobs in real-time via metric dashboards alongside our automated Active Job dashboard that tracks job status, throughput, duration, and more.
Why monitor your Ruby app's Shoryuken jobs?
AppSignal's Ruby APM offers comprehensive insights for fine-tuning your Ruby app's Shoryuken job performance. Easily inspect Shoryuken job execution, status, throughput, and duration through AppSignal's automated dashboards and metric monitoring.
AppSignal's suite of developer-friendly Ruby monitoring tools, including exception tracking, anomaly detection, and logging capabilities, give you a helicopter view of your application's performance, helping you confidently monitor, optimize, and scale your Ruby app.
AppSignal Shoryuken monitoring helps you
Effortlessly track the performance of your app's Shoryuken jobs.
Get to the root cause of an exception quickly.
Monitor your entire Ruby app's performance alongside your Shoryuken jobs.
Gain deep, contextual insights into performance issues.
Start monitoring your Shoryuken jobs today
Ready for deep Shoryuken job performance insights? Get started by signing up, installing AppSignal, and exploring our Ruby documentation for more detailed setup instructions.


