Active Record monitoring
AppSignal gives you deep insights into the performance of your application's Active Record queries. With AppSignal, you can solve common Active Record problems like slow and inefficient queries and be notified when exceptions and anomalies occur.

Key Active Record monitoring features
Error Tracking
Find and fix Active Record query errors. Learn more
Performance Monitoring
Efficiently optimize slow Active Record queries. Learn more
Anomaly Detection
Be the first to know when an Active Record anomaly occurs. Learn more
Automated Dashboards
Visualize and track your Active Record metrics. Learn more
Monitor and debug Active Record performance
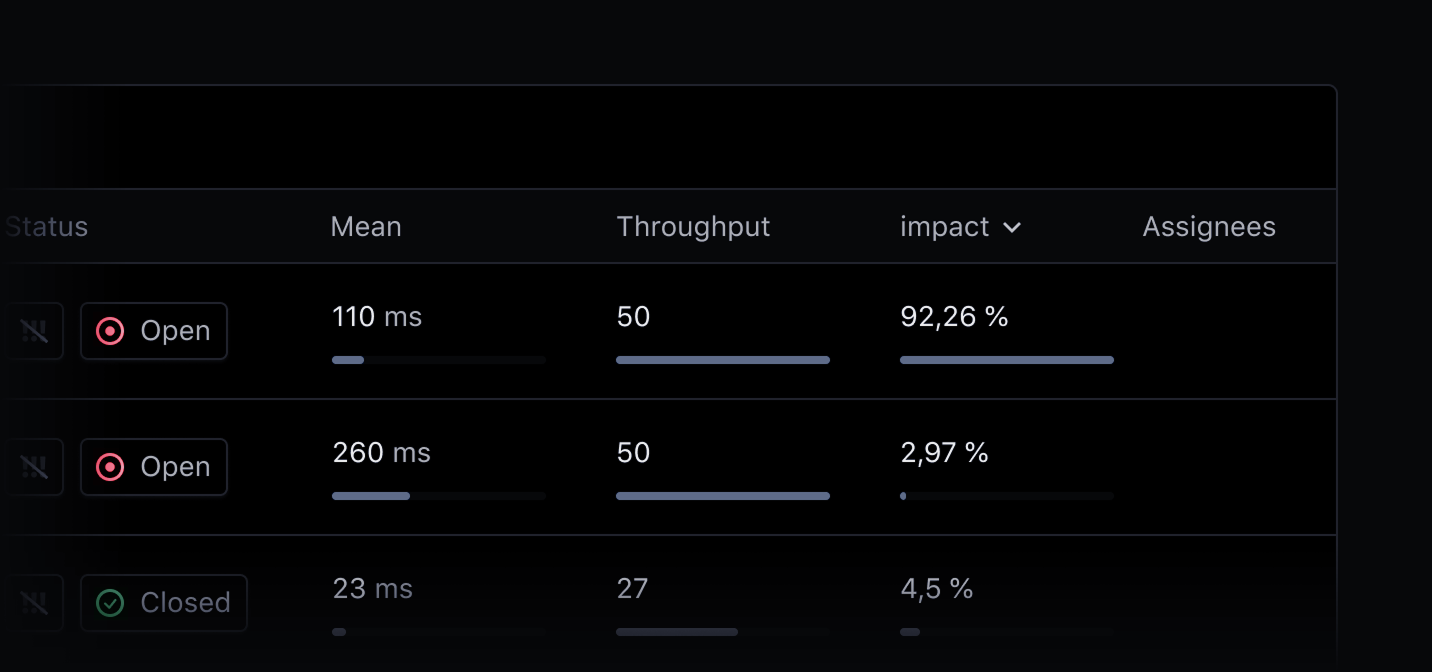
View impact, throughput, and duration for every query
Get an overview of the queries with the most impact on your app's performance by looking at throughput times duration.
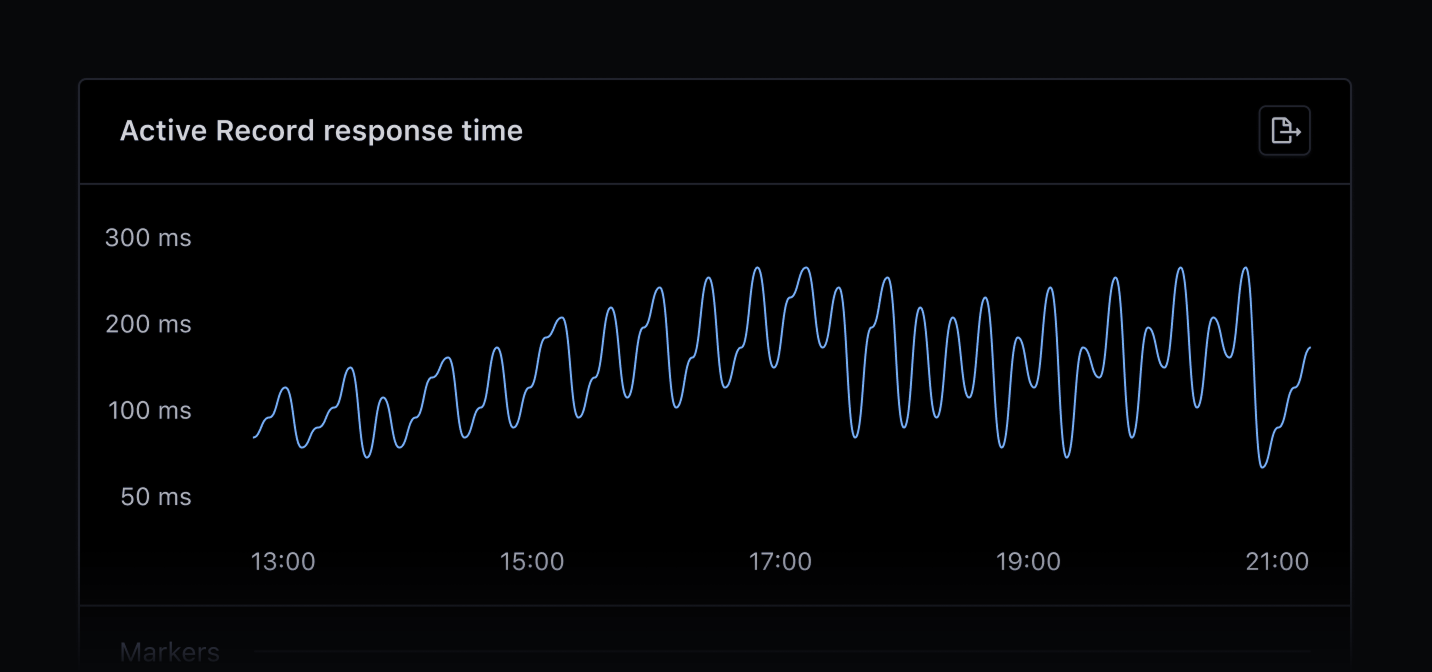
Get alerts for slow Active Record query response times
AppSignal automatically instruments Active Record and monitors all queries. Set triggers and alerts for when your response times get too long.
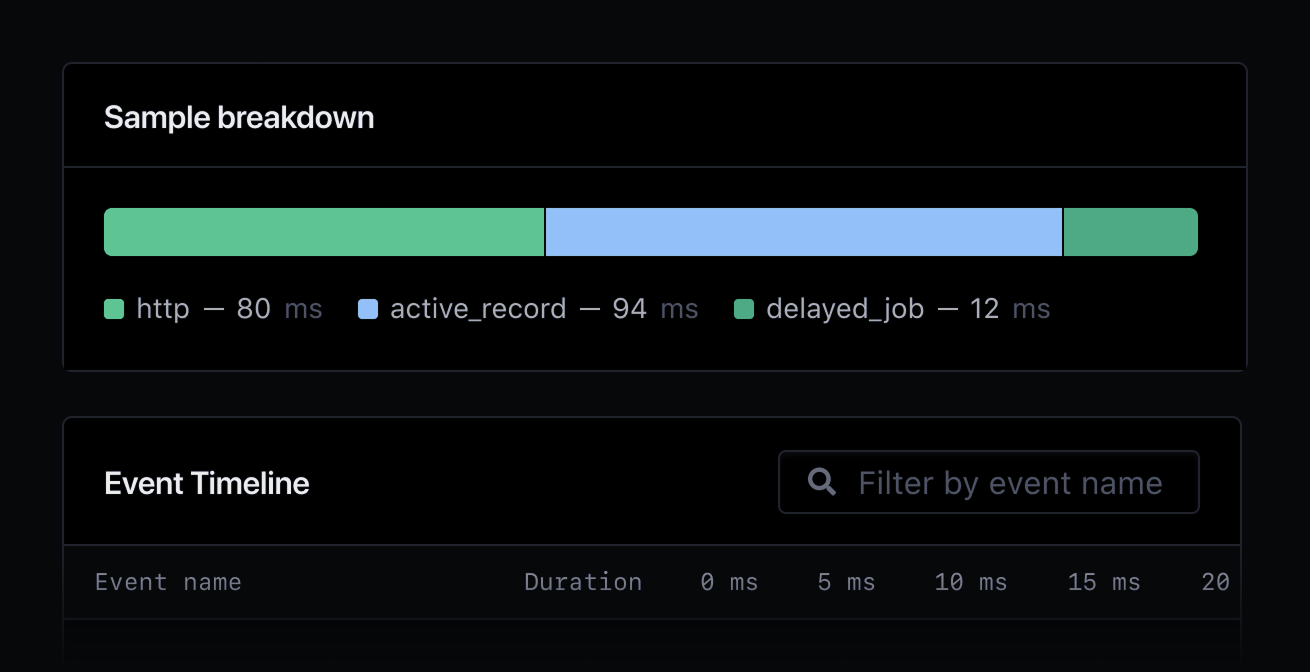
Find bottlenecks in Active Record performance
AppSignal can alert you to performance issues. The Performance screen for an action will show a breakdown of the durations within a sample.
Why monitor Active Record?
AppSignal's Ruby APM provides valuable deep insights into your Active Record performance metrics, helping you fine-tune the performance of your database. Use our Active Record insights to find N+1 queries and fine-tune slow database queries before they impact your application's performance.
Connect the dots between your Active Record performance and other elements of your application's stack with AppSignal's comprehensive suite of monitoring features, like exception monitoring, anomaly detection, and logging.
AppSignal Active Record monitoring helps you
Find N+1 queries.
Have an overview of slow queries.
Optimize query performance.
Understand the performance of Active Record queries on a granular event level.
Understand Active Record's performance in the broader context of your Ruby application's stack.
Start monitoring your Active Record queries today
Ready for deep insights into your Active Record performance? Get started by signing up, installing AppSignal, and exploring our Ruby documentation for more detailed setup instructions.


